

As we note from time to time, the Bureau of Labor Statistics monthly Job Openings and Labor Turnover Survey (JOLTS) provides rich material to understand the current and emerging job world in the United States and California.
In the past few years, we have drawn on JOLTS data relating to the enormous number of job openings on any given day (over 400,000 openings in California on an average day in December 2013), as well as the enormous number of Hires (over 450,000 Hires and an equal number of Separations in California in December 2013).
JOLTS include another key data base: the number of unemployed persons per job opening. The most recent data through December 2013 shows that the number of unemployed persons per job opening has fallen significantly since the Great Recession, when it reached over 6.2 per job opening in mid-2009. It is down to 2.6 per job opening in December 2013, not too far above what it was in January 2003.
As BLS Regional Commissioner Richard Holden explains, JOLTS is broken down by region but not by state, so we do not have California-level JOLTs data. However, EDD’s Labor Market Information Division utilizes another database, the Conference Board Help Wanted Online Data Series (HWOL), that tracks job advertisements on 16,000 internet boards, corporate boards and small job sites. Mr. Brandon Hooker of LMID forwards the chart below on the number of unemployed persons per job listings in California (and the United States), from 2005 to the present (click to enlarge).
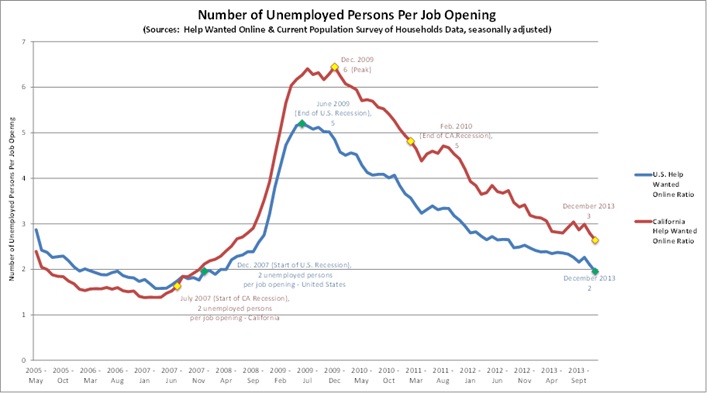 Both California and the United States rose sharply during the Great Recession and have gone down since 2009. The number of unemployed persons per job opening according to these ad counts is smaller than in the JOLTS data. Mr. Spencer Wong offers the best explanation in noting the difference in what’s being counted-counts of job ads (by the Conference Board) versus actual job openings (BLS). According to Mr. Wong, “Some employers keep job ads in place to ensure a flow of fresh resumes, even in the absence of actual job openings, and this has the potential to inflate the number of job openings being reported through HWOL”.
Yet, a bigger question remains from both the JOLTS and HWOL data. Talk to any job coach, workforce practitioner or job seeker in California and you will hear that job search today is far, far more difficult in 2014, even than in the early 2000s. Why do these data not reflect this difficulty?
Mr. Wong offers one explanation: the low and declining labor force participation rate, at its lowest in California since 1978. Persons who are not counted as being in the labor force are not counted for these data as being unemployed. Additionally, part-time and contingent workers are not counted as being unemployed for these data, nor are independent contractors. Mr. Paul Wessen of LMID adds, “I would suggest that looking at the labor market in the aggregate does not mean that the situation for low skilled workers and/or specific industries or occupations isn’t very different. That is to say some workers are affected much more than others.”
Further, economist Scott Winship of Brookings has noted that from 1951-2007, it was rare for the number of unemployed persons per job opening to even reach two to one. The ratio increased during the recession of 2001 and failed to return to the pre-2001 level even after the 2001 recession. Though the job market maintains strong cyclical elements, the “normal” non-recession level has been moving upward.