

“Pension-change advocates failed to find funding for a measure during the depths of the 2008 recession and the havoc it wreaked on government budgets, so they won’t pass (a measure) when the economy is doing well.”
– Steve Maviglio, political consultant and union coalition spokesperson, Sacramento Bee, January 18, 2016
It’s hard to argue with Mr. Maviglio’s logic. If the economy is healthy and the stock market is roaring, fixing the long-term financial challenges facing California’s state/local government employee pensions systems will not be a top political priority. But that doesn’t mean those challenges have gone away.
One of the biggest problems pension reformers face is communicating just how serious the problem is getting, and one of the biggest reasons for that is the lack of good financial information about California’s government worker pension systems.
The California State Controller used to release a “Public Retirement Systems Annual Report,” that consolidated all of California’s 80 independent state and local public employee pension systems into one set of financials, but they discontinued the practice in 2013. The most recent one issued, released in May, 2013, was itself almost two years behind with financial data – using FYE 6-30-2011 financial statements, and it was almost three years behind with actuarial data – used to report funding ratios – using FYE 6-30-2010 actuarial analysis. Now the state controller has created a “By the Numbers” website, but it’s hard to use and does not provide summaries.
No wonder it’s so easy to assert that nothing is wrong with California’s pension systems!
The best source of raw data on California’s pensions comes from the U.S. Census Bureau. Since that data is better than nothing, here are some critical areas where roughly accurate numbers can be reported.
(1) The Cash Flow, Money In vs. Money Out
What is the net cash flow of these pensions funds? How much are they collecting in contributions and how much are they distributing in pension benefits? This information, especially if it can be compiled over a period of years, determines whether or not pension funds are net buyers or sellers in the markets. The reason this matters is because if America’s pension funds, with over $4.0 trillion in assets, are net sellers, they put downward pressure on stock prices. They’re that big.
California State/Local Pension Funds Consolidated
2014 – Cash Flow
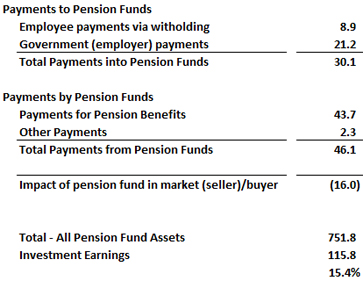
This cash flow (above) shows that during 2014, California’s state/local pension funds, combined, collected 30.1 billion from state and local agencies, and paid out $46.1 billion to pensioners. They are paying out 50% more than they’re taking in, and this is a relatively recent phenomenon. Historically, pension funds have been net buyers in the market. Now, pension funds across the U.S., along with retiring baby boomers, are sellers in the market. This is one reason it is difficult to be optimistic about securing a 7.5% average annual return in the future, despite historical results. And as for that healthy 15.4% return on investments in 2014? That was offset in 2015, when the markets were flat. It is also noteworthy that employee contributions of $8.9 billion are greatly exceeded by the $21.2 billion in employer (taxpayer) contributions. How many 401K recipients get a 2.5 to 1.0 matching from their employer?
(2) The Asset Distribution and Portfolio Risk
What is the asset distribution of these pension funds? How much have they invested in relatively risk free, fixed income bonds, vs. their investments in stocks and other variable return assets?
California State/Local Pension Funds Consolidated
2014 – Asset Distribution
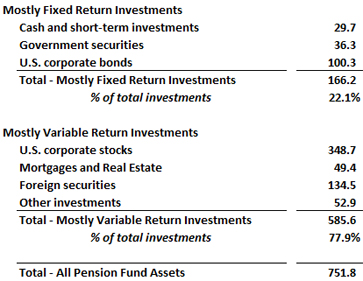
This asset distribution table (above) indicates that the ratio of riskier, variable return investments to fixed return investments is nearly four-to-one. What if stocks fail to appreciate for a few years? What if real estate values don’t continue to soar? What if there simply aren’t enough high-yield investments out there to allow these assets, valued at a staggering $751 billion in 2014, to throw off a 7.5% annual return? This is a precarious situation. If these projected 7.5% returns were truly “risk free,” the ratios on this table would be reversed, with most of the money in fixed return investments.
(3) The Unfunded Liability and the “Catch-up” Payments
What is the amount of the unfunded liability for these pension funds? And of the total amount collected and invested each year in these funds, how much is the “unfunded contribution” – the amount allocated to pay down the unfunded liability and eventually restore the systems to 100% funding – and how much is the “normal contribution” – the amount required to fund future pension benefits just earned in that particular year by active workers?
This question, for which neither the State Controller, nor the U.S. Census Bureau, can provide timely and accurate answers, is the most complex and also the most important. While consolidated data is not readily obtainable for these variables, by assuming these pension systems, in aggregate, are officially recognized as 75% funded, we can compile useful data:
California State/Local Pension Funds Consolidated
2014 – Est. Required Unfunded Contribution
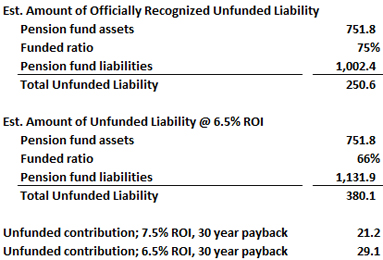
The above table estimates that at a 75% funded ratio, at the end of 2014 the total pension fund liabilities for all of California’s state and local government pension funds was just over $1.0 trillion, with unfunded liabilities at $250 billion. The middle portion of the table shows, using conventional formulas adopted by Moody’s investor services for analyzing public pensions, that if the annual rate-of-return projection is lowered to a slightly more realistic 6.5% (already being phased in by CalPERS), the unfunded liability jumps to $380.1 billion, and the funded ratio drops to 66%. For a detailed discussion of these formulas, refer to the California Policy Center study “A Method to Estimate the Pension Contribution and Pension Liability for Your City or County.”
The lower portion of the table spells out just how deep a hole California’s state and local public employee pension systems have dug for themselves. Using standard amortization formulas, and a quite lengthy 30 year payback term, at a 6.5% rate-of-return assumption, it would take a payment of $29.1 billion per year to return California’s pension funds to 100% funded status by 2046. Since the total payments into California’s pension funds – refer back to table 1 – were only 30.1 billion in 2014, it is pertinent to wonder just how much the normal contribution was, in aggregate, in 2014, vs. the unfunded contribution.
One promising pension transparency project is being directed by professors Joshua Rauh and Joe Nation via Stanford University’s Institute for Economic Policy Research. Their “Pension Tracker” website has already compiled an impressive body of data, especially useful at the local level. Hopefully they, or someone, will get eventually compile and present accurate data, both locally and statewide, not only showing cash flows, but differentiating between the normal contributions and the unfunded contributions.
In the absence of data, here’s a rough guess: Approximately 1.5 million active state and local government workers in California probably earned pension eligible income of at least $100 billion in 2014. If the “normal contribution” is 16% of payroll, that equates to $16 billion per year. This is a very conservative estimate.
Mr. Maviglio, and all of his colleagues who wish, like many of us, to save the defined benefit pension, are invited to explain how California’s pension systems will ever become healthy, if, best case, their required unfunded contribution is $29.1 billion per year, their required normal contribution is $16 billion per year, and the total payments actually being made per year are only $30.1 billion. That’s a shortfall of $15 billion per year.
* * *
Ed Ring is the executive director of the California Policy Center.