

“Time has a wonderful way of showing us what really matters.” – Margaret Peters
State climate policies are boosting the San Joaquin Valley’s economy. At least that’s the basic message that the authors of a recent study are trying to convey.
On January 19 the Bay Area organization Next 10 released a commissioned report entitled The Economic Impacts of California’s Major Climate Programs on the San Joaquin Valley. Conducted by U.C. Berkeley’s Donald Vial Center on the Green Economy and its Center for Law, Energy and the Environment, the study attempts to quantify the economic impacts of three of California’s major climate programs and policies in the Valley: cap and trade, the renewables portfolio standard (RPS), and energy efficiency programs managed by investor-owned utilities.
The report concludes that the three climate programs generated more than $13.4 billion in total net economic benefits in the San Joaquin Valley. Additionally, it finds that these programs increased employment in the region: the cap-and-trade program created 1,612 total jobs in the San Joaquin Valley while the RPS created 88,000 total jobs and energy efficiency created 17,400 total jobs.
These findings sound encouraging. And environmental activists will certainly use them to try to convince skeptical Valley politicians that climate policies will combat, rather than exacerbate, high levels of unemployment in the region.
So it’s fair to ask did the climate programs really boost the San Joaquin Valley economy?
Let me say at the outset that I appreciate the authors’ attempt to do a net-economic impact analysis of the climate programs. As an economist and an advocate of informed public policymaking, I think that accounting for both the costs and the benefits is the fair approach.
That said, let’s assume for now that the report’s estimates of economic benefits and job impacts are accurate. One can critique the study methodology – the authors admit, for example, that they “did not attempt to estimate regional economic costs of the RPS” (page 45) meaning that their RPS figures show only the benefits – but I want to focus on one specific issue here.
That issue is time.
The authors are, to be charitable, less than transparent in communicating the time periods over which their estimated economic benefits occur. This is a significant oversight. For a $157 billion Valley economy (page 36), it is important to know whether the $13.4 billion in net economic benefits were realized in a single year (8.5 percent of annual economic activity) or instead across five years (1.7 percent) or ten years (0.9 percent).
In this case, the answer is fourteen years. (The report presents RPS data spanning 2002 to 2015, and although cap and trade was only in existence toward the tail end of this period and the authors collected energy efficiency data only from 2010 to 2015, the RPS was responsible for most of the economic impact identified so the fourteen-year timeframe is correct.)
In other words, the three climate programs generated on average about $960 million of net economic benefits a year in the San Joaquin Valley, or 0.6 percent of the region’s economy. That’s hardly a boost.
The lack of transparency with respect to time also extends to employment impacts. Typically when people hear the term “job” they think of permanent, full-time employment, but that’s not what is measured in the report. Buried in an endnote, we learn that the job statistics are instead measured in “job-years.”
What’s a job-year? Think of it as temporary, full-time employment where the job lasts only twelve months. It’s a convention developed by economists to measure the economic impact of short-term construction projects, like the building of a new school or highway.
Using job-years rather than jobs is appropriate in this study, given that much of the job creation resulted from the construction of renewable power plants under the RPS. But this fact should be made explicit, because the job impacts look much different when placed in the appropriate context.
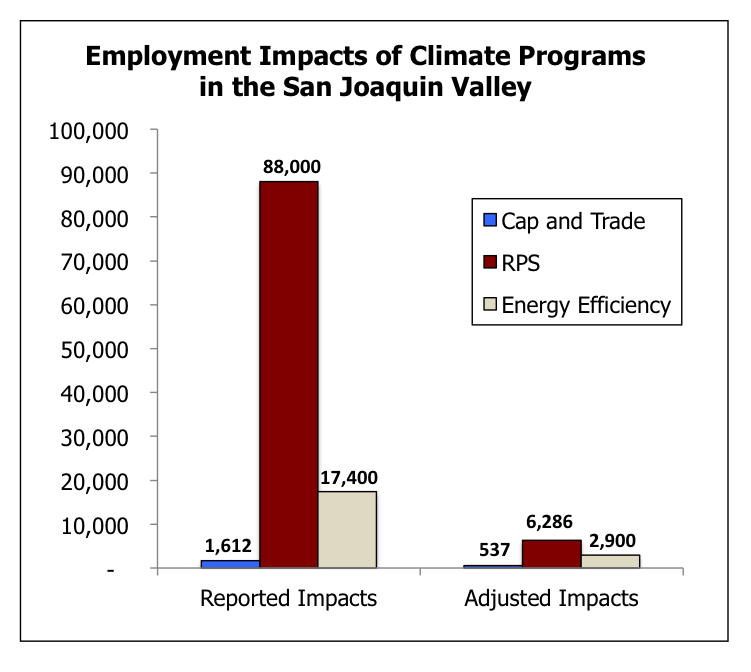
The chart above shows the climate programs’ job impacts adjusted by the number of years of data in the report. With the employment estimates adjusted in this way, we can gauge the average number of (permanent) jobs that the programs support. The chart shows that the programs support on average a total of 9,723 jobs, with 537 coming from cap and trade, 6,286 from RPS and 2,900 from energy efficiency.
That’s a far cry from the 107,000 jobs suggested by the authors. With regional employment totaling 1,858,254 (page 36), the 9,723 actual jobs indicate that climate programs generated a mere 0.5 percent of employment.
Again, these figures assume that the reported economic benefits and job impacts are accurate. Once the methodology gets scrutinized – one could argue for example that power-plant construction in the Valley would have been the same without the RPS, just focused on natural gas generation – it is likely that these estimated benefits and impacts would diminish further or even go negative.
But time is the subject of this analysis, and by just properly accounting for time it becomes clear that the report’s conclusions are incorrect. In the best case, the climate programs’ contributions to the San Joaquin Valley economy are negligible.
Time indeed has a wonderful way of showing us what really matters.
Dr. Justin L. Adams is the President and Chief Economist of Encina Advisors, LLC, a Davis-based economics research and analysis firm.