

Seeking to fill the gap between opinion and factual information about job creation and sustainability, as well as economic trends in California, the Center for Jobs and the Economy recently launched a more robust website so that anyone will be able to better see and understand the nexus between California’s job environment and the economy. The enhanced website will allow, for the first time, a comprehensive, in-depth look at the economic health of California communities through the use of continuously updated economic data, which will better illustrate California’s ever-changing economic landscape.
Harnessing available but disparate data sources, the Center for Jobs and the Economy has built a one-stop resource using key, and continuously updated economic indicators like unemployment, average annual wage, housing and fuel costs, searchable by county, region and Senate and Assembly districts. These indicators will provide current and accurate measures of economic health and stability in communities across California or detail where more work needs to be focused to stimulate the economy in others.
These additions to the website will allow users to not only see how the state’s economy has become increasingly two-tiered with some counties and legislative districts flourishing while others languish, but to better understand the specific factors and drivers within those areas that have contributed to those trends. By combining data in a single place, the website allows users to more easily see the details that lead to broader social developments. For example, in some counties, we see employment declining in certain industries while wages surge dramatically. By putting these two facts together, it is easy to see that the middle and lower income jobs have left the region while the remaining jobs reflect higher-wage workers who can afford to live in the region.
In its initial version, released last year, the Center’s employment data tool allowed users to visualize the jobs environment in a specific location by assembling employment and wage data in a convenient framework and displaying the data both on an overall perspective as well as at the industry level. Its graphic map interface also provided users with the data on a regional, county, state senate and state assembly district basis, allowing them to ask the question, “what is happening in this place and how does that compare to other places?”
In the Center’s new data infrastructure, that information has been expanded and supplemented to help users answer the question, “Why do I see these trends happening here?” The new “Economic Indicator” section of the website allows anyone to explore the key dimensions of the economic life of the state’s many geographies, providing current and historical data on cost of living, economic opportunity, workforce preparedness, economic disparity, revenue measures, energy cost, and quality of life.
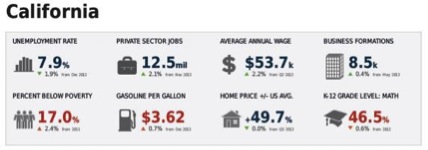 Upholding the Center’s commitment to making accurate and current data as available as possible to inform policy choices, the data reported are taken from a myriad of public and private sources and updated in real-time as new information becomes available. In the new economic indicators section, a dashboard provides site users with a quick overview of the selected area’s general economic conditions.
Robert Lapsley is president of the California Business Roundtable, which created the Center for Jobs and the Economy, and Pepperdine Professor Dr. Michael Shires, who serves on the Research Advisory Council for the Center for Jobs and the Economy.