There is considerable concern about rising rents, especially in the most expensive US housing markets. Yet as tough as rising rents are, the high rent markets are also plagued by even higher house costs relative to the rest of the nation. As a result, progressing from renting to buying is all the more difficult in these areas.
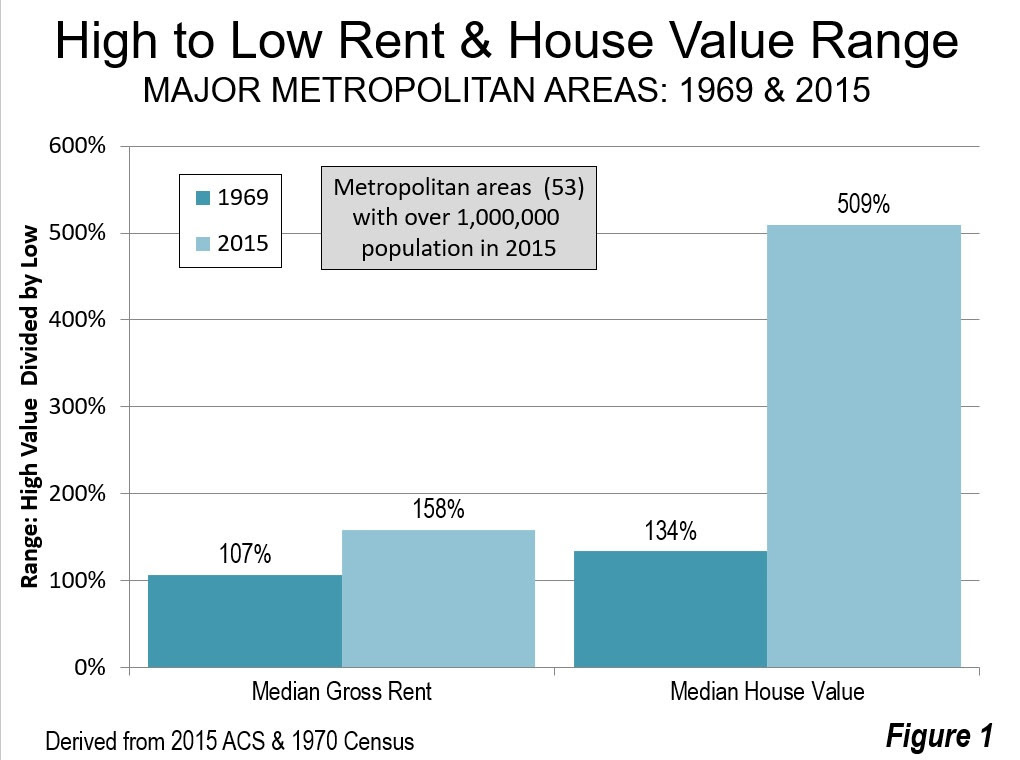
This is illustrated by American Community Survey data for the nation’s 53 major housing markets (metropolitan areas with more than 1,000,000 residents). The range in median contract rent between the major housing markets 3.1 times, with San Jose being the most expensive and Rochester the least. The range in median house values was more than double that, at 6.6 times, between highest cost San Jose and lowest cost Pittsburgh. Thus, house prices in the most expensive markets tend to be far higher in relation to rents than in the less expensive markets.
The rising difference between house values and rents was noted last year in The House Prices are Too Damned High, which showed that from 1969 to 2015, the difference in the range between rentals and house values rose from 51 percentage points to 375 percentage points (Figure 1). It is no coincidence that 1969 was the last census data before far more strict land use regulations were implemented in some major housing markets.

The House Value-to-Rent Ratio
This is illustrated by the median house value-to-rent ratio, which is calculated by dividing the median house value by the median contract rent per year (monthly times 12). Overall in 2016, the median contract rent was $841 in the United States, while the median house value was $205,000. This calculates to a value-to-rent ratio of 20.3.
Where Housing Aspiration is Most Challenging
California, long home to house prices far above the rest of the nation dominates the list of housing markets in which it is hardest for buyers to move up to home ownership. The worst market is the San Francisco metropolitan area, where the median house value in 2016 was nearly 40 times the median annual rent (39.6) and nearly twice the national figure of 20.3. San Jose is the second worst market, with a value-to-rent ratio of 38.7. Los Angeles is third where the median house value is 36.9 times the median annual rent. There is a larger gap down to San Diego, ranked fourth worst, where there is a median value-to-rent ratio of 31.1. Sacramento is also in the least friendly five for renters aspiring to be buyers, with a value-to-rent ratio of 29.6. This may be a surprising finding and is discussed further below. California’s other major market, Riverside-San Bernardino does better, ranking 13th worst, with a value-to-rent ratio of 24.5.
Even with New York’s notoriously high rents, it did not muscle out California in the worst five. New York’s s value-to-rent ratio was 29.5 The balance of the 10 markets in which moving from renting to buying is most difficult also includes #7 Boston (28.1), #8 Portland (27.9), #9 Providence (27.7) and #10 Seattle (27.2).
Comparison with Demographia Housing Affordability Ratings
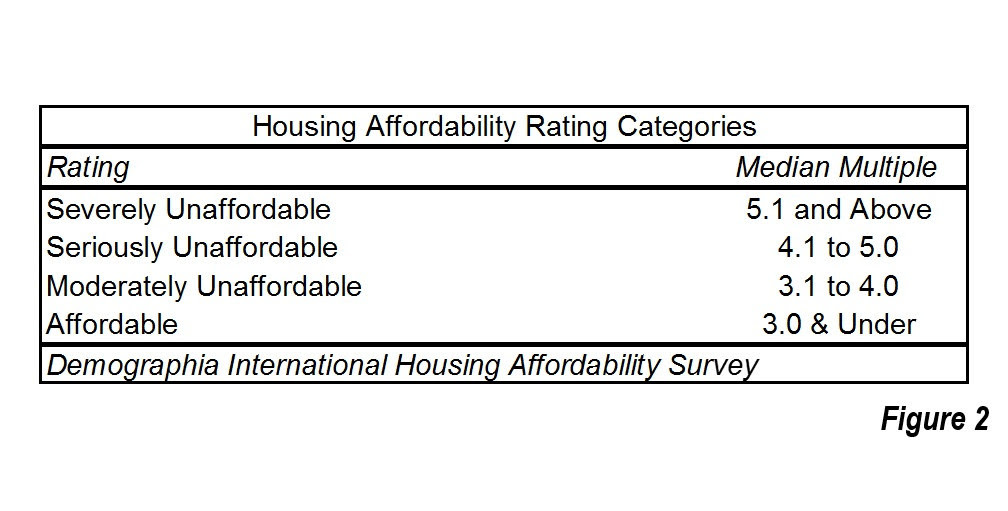
The eleven housing markets with the highest value-to-rent ratios have ratings of “severely unaffordable” in the 13th Annual Demographia International Housing Affordability Survey. This is the least affordable rating (Figure 2) and indicates a median multiple of 5.1 or higher (median house price divided by median household income). The 12th highest value-to-rent ratio is in Salt Lake City, which is rated “seriously unaffordable,” the second most unaffordable category. Thirteenth ranked Riverside-San Bernardino was the only other severely unaffordable major U.S. housing market in the Demographia survey.
Each of the severely unaffordable markets have land use restrictions that make it virtually impossible to build the low-cost suburban tract housing crucial to retaining housing affordability. In such markets, Buildzoon.coms’ economist Issi Romem has shown that house values have become detached from construction costs, largely the result of rising land prices (which are associated with stronger land use regulation, especially urban containment policy).

The Surprising Case of Sacramento
Sacramento’s high cost housing may come as a surprise. Sacramento has often “slipped under the radar” as a severely unaffordable market, yet was so from 2004 through 2008.Sacramento had reached a median multiple of 6.8 in 2005 before the housing bust and was less affordable than Vancouver, the third least affordable housing market out of nine nations rated in 2016 by Demographia. Sacramento again became severely unaffordable in last year’s Demographia survey reaching a median multiple of 5.1. But there is reason for concern in Sacramento, which has seen its median multiple rise from 2.9 to 5.1 in just four years. Any continuation of such this trend could result in a material deterioration of Sacramento’s value-to-rent ratio, made all the more likely by California’s overly restricted housing and land use regulations.
The Value-to-Rent Ratio and Inequality
Rising inequality is a widespread concern. Yet, as researchers have shown, much of the expanding inequality is centered in the value of owned housing, which has been associated with more restrictive land and housing regulation. In the United States, the price is being paid for by younger households, who are faced with greater student loan debts and a less lucrative economy. It is also paid for by ethnic minority households, whose more limited incomes are making the jump to home ownership even more difficult (See: Progressive Cities: Home of the Worst Housing Inequality).
| Median House Value to Median Contract Rent Ratios | |||||
| 53 Major US Housing Markets (Metropolitan Areas) | |||||
| Worst Markets for Moving from Renting to Buying | |||||
| Rank | Housing Market (Metropolitan Area) | Value-to-Rent Ratio | Median Contract Rent (Monthly) | Median House Value | Housing Affordabilty Rating |
| 1 | San Francisco-Oakland, CA | 39.56 | $1,677 | $796,100 | Severely Unaffordable |
| 2 | San Jose, CA | 38.69 | $1,964 | $911,900 | Severely Unaffordable |
| 3 | Los Angeles, CA | 36.92 | $1,305 | $578,200 | Severely Unaffordable |
| 4 | San Diego, CA | 31.07 | $1,415 | $527,600 | Severely Unaffordable |
| 5 | Sacramento, CA | 29.62 | $1,022 | $363,300 | Severely Unaffordable |
| 6 | New York, NY-NJ-PA | 29.05 | $1,223 | $426,300 | Severely Unaffordable |
| 7 | Boston, MA-NH | 28.14 | $1,222 | $412,700 | Severely Unaffordable |
| 8 | Portland, OR-WA | 27.89 | $1,031 | $345,000 | Severely Unaffordable |
| 9 | Providence, RI-MA | 27.77 | $796 | $265,300 | Seriously Unaffordable |
| 10 | Seattle, WA | 27.23 | $1,198 | $391,500 | Severely Unaffordable |
| 11 | Denver, CO | 24.79 | $1,174 | $349,200 | Severely Unaffordable |
| 12 | Salt Lake City, UT | 24.60 | $907 | $267,800 | Moderately Unaffordable |
| 13 | Riverside-San Bernardino, CA | 24.47 | $1,086 | $318,900 | Severely Unaffordable |
| 14 | Washington, DC-VA-MD-WV | 23.74 | $1,444 | $411,400 | Seriously Unaffordable |
| 15 | Baltimore, MD | 23.21 | $1,055 | $293,900 | Moderately Unaffordable |
| 16 | Milwaukee,WI | 23.07 | $737 | $204,000 | Seriously Unaffordable |
| 17 | Hartford, CT | 22.83 | $903 | $247,400 | Moderately Unaffordable |
| 18 | Raleigh, NC | 22.56 | $878 | $237,700 | Moderately Unaffordable |
| 19 | Philadelphia, PA-NJ-DE-MD | 22.27 | $919 | $245,600 | Moderately Unaffordable |
| 20 | Las Vegas, NV | 22.06 | $883 | $233,700 | Seriously Unaffordable |
| 21 | Phoenix, AZ | 21.97 | $876 | $231,000 | Seriously Unaffordable |
| 22 | Richmond, VA | 21.81 | $868 | $227,200 | Moderately Unaffordable |
| 23 | Minneapolis-St. Paul, MN-WI | 21.64 | $926 | $240,500 | Moderately Unaffordable |
| 24 | Virginia Beach-Norfolk, VA-NC | 21.27 | $940 | $239,900 | Moderately Unaffordable |
| 25 | Austin, TX | 21.20 | $1,035 | $263,300 | Seriously Unaffordable |
| 26 | Cincinnati, OH-KY-IN | 21.08 | $653 | $165,200 | Affordable |
| 27 | Nashville, TN | 21.00 | $829 | $208,900 | Moderately Unaffordable |
| 28 | Louisville, KY-IN | 20.94 | $645 | $162,100 | Moderately Unaffordable |
| 29 | St. Louis,, MO-IL | 20.64 | $683 | $169,200 | Affordable |
| 30 | Chicago, IL-IN-WI | 20.60 | $930 | $229,900 | Moderately Unaffordable |
| 31 | Kansas City, MO-KS | 20.38 | $711 | $173,900 | Affordable |
| 32 | Columbus, OH | 20.15 | $712 | $172,200 | Affordable |
| 33 | Birmingham, AL | 20.15 | $637 | $154,000 | Moderately Unaffordable |
| 34 | New Orleans. LA | 19.89 | $788 | $188,100 | Moderately Unaffordable |
| 35 | Oklahoma City, OK | 19.86 | $647 | $154,200 | Affordable |
| 36 | Tucson, AZ | 19.82 | $716 | $170,300 | Moderately Unaffordable |
| 37 | Charlotte, NC-SC | 19.77 | $793 | $188,100 | Moderately Unaffordable |
| 38 | Pittsburgh, PA | 19.62 | $631 | $148,600 | Affordable |
| 39 | Miami, FL | 19.36 | $1,122 | $260,600 | Severely Unaffordable |
| 40 | Grand Rapids, MI | 19.20 | $714 | $164,500 | Affordable |
| 41 | Atlanta, GA | 18.72 | $880 | $197,700 | Moderately Unaffordable |
| 42 | Buffalo, NY | 18.63 | $636 | $142,200 | Affordable |
| 43 | Cleveland, OH | 18.47 | $659 | $146,100 | Affordable |
| 44 | Indianapolis. IN | 18.43 | $694 | $153,500 | Affordable |
| 45 | Detroit, MI | 18.37 | $729 | $160,700 | Affordable |
| 46 | Jacksonville, FL | 18.33 | $853 | $187,600 | Moderately Unaffordable |
| 47 | Dallas-Fort Worth, TX | 18.13 | $869 | $189,100 | Moderately Unaffordable |
| 48 | Orlando, FL | 17.72 | $948 | $201,600 | Seriously Unaffordable |
| 49 | Memphis, TN-MS-AR | 17.69 | $671 | $142,400 | Moderately Unaffordable |
| 50 | Houston, TX | 17.36 | $871 | $181,400 | Moderately Unaffordable |
| 51 | San Antonio, TX | 16.65 | $802 | $160,200 | Moderately Unaffordable |
| 52 | Tampa-St. Petersburg, FL | 16.61 | $879 | $175,200 | Seriously Unaffordable |
| 53 | Rochester, NY | 15.97 | $725 | $138,900 | Affordable |
| Sources: American Community Survey 2016, 13th Annual Demographia International Housing Affordability Survey. | |||||

