
In the Governor’s race, the primary jobs discussion in the final month should be about the next 4 years and beyond, and strategies for job growth and sustainability.
However, the Whitman campaign continues to make Jerry Brown’s governorship from 1975-1981 a main issue, including the claim that it was a time of job loss and unemployment. As someone involved in job training during that time, I didn’t recall it that way, and dug up the payroll job growth during that time and the terms of subsequent governors. The research showed a 1.9 million job growth during Brown’s governorship-a larger share of the national job growth than any subsequent time.
A few days ago, Marc Lifsher of the Los Angeles Times wrote of a new study by an economist at Claremont McKenna College that is being pushed by the Whitman campaign as evidence of Brown’s employment failure. Claremont McKenna is one of our leading colleges in California. The study was conducted by the Lowe Institute of Political Economy.
The study, "Back to the Future? Scoring California Governors’ Job Record", though, is amateur hour. Here is the link. The author, Professor Brock Blomberg, focuses on the California unemployment rate from 1976 to the present. His main methodology is to compare the unemployment rate when each Governor took office with the unemployment rate when that Governor left office.
First, there are the obvious mistakes in the study. The vertical axis of chart 2 is labeled Jobs Gained/Jobs Lost, but the chart has nothing to do with jobs gained or lost. It should be labeled Unemployment Rate Change.
Second, the unemployment rate when a Governor takes office or leaves offices is a snapshot in time. It says little or nothing of the jobs gained or the unemployment rate during the time when the Governor was in office.
Third, and most important, the state unemployment rate has little meaning if it is not in the context of the national unemployment rate. As I and many others have written, the main determinant of the state rate over the past 40 years has been the national rate. The state rate with rare exception has followed the ups and downs of the national rate. Take a look at the chart below, graphing the state and national rates. Unemployment did rise significantly at the end of Brown’s term, during the time that the national unemployment rate rose to its post World War II high. Unemployment also did rise significantly during Pete Wilson’s term, in line with the national unemployment rate increase.
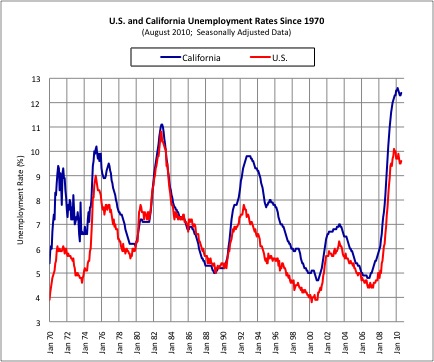
Source: California Employment Development Department, 2010
I utilized payroll job numbers for my analysis and compared the state payroll job growth to the national job growth under each Governor. My argument was not that Brown deserved sole credit for the high job growth during his governorship-clearly that was a time when our state economic structure was different. My argument was that it was inaccurate to describe his governorship as employment failure.
If Blomberg wants to make his argument with some knowledge of the economy of California in the 1970s and 1980s, he should do so. His use of snapshots of the state unemployment rate, though, is not worthy of his distinguished college.