Everyone has an explanation for why the California Republican Party was dominated in the last election. Immigration, demographics, social issues, taxes, etc. But, all the blathering has ignored the elephant in the room: money.
Big business and big labor teamed up and spent big money to elect Democrats. And they used party central committees to funnel this money to targeted legislative candidates. You can read all about the suspicious campaign financing of the Quirk-Silva campaign in this post.
Both parties used this tactic to fund their targets. Democrats, however, accepted checks with an extra zero. This money laundering is, of course, done with a wink and a nod. “How do you prove the money was laundered and not just a big coincidence?” a skeptic might ask.
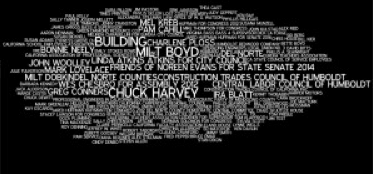
People are uncomfortable with numbers. That’s why I have created a few visual representations of these county party transfers to make it easier to understand this money laundering. Here’s a snapshot of every contributor to the Humboldt County Democratic Central Committee in 2012. It’s how most people would read a campaign report.
It’s a confusing mess, and that’s exactly the point. Special interest groups hide in plain sight with this web of financial data. In 2012, the Humboldt County Democratic Party accepted $232,618 in 144 different transactions. But, it’s hard to understand what all of those contributions mean.
Let’s change the visualization to give greater weight to bigger transactions. Here’s what it looks like when the size of the font is proportional to the size of the contribution.
Wow! Suddenly, everything is much clearer. That’s because 89% of the Humboldt County Democratic Party’s contributions came from just 7 special interest groups. Those groups are: AFSCME, California State Council of Service Employees, California Teachers Association, California School Employees Association, Serivce Employees International Union Local 1000, Professional Engineers in California Government PECG PAC, and the Building and Construction Trades Council of California PAC.
Each of these groups sent a check for at least $25,000 to the party in August or September.
| Contributor | Amount | Date |
| AFSCME |
$32,500.00 |
9/19/2012 |
| CA STATE COUNCIL OF SERVICE EMPLOYEES |
$32,500.00 |
9/14/2012 |
| CALIFORNIA TEACHERS ASSOCIATION |
$32,000.00 |
9/22/2012 |
| CALIFORNIA SCHOOL EMPLOYEES ASSOCIATION |
$30,000.00 |
9/19/2012 |
| SERVICE EMPLOYEES INTERNATIONAL UNION LOCAL 1000 |
$30,000.00 |
9/19/2012 |
| PROFESSIONAL ENGINEERS IN CALIFORNIA GOVERNMENT PECG-PAC |
$25,000.00 |
9/28/2012 |
| BUILDING & CONSTRUCTION TRADES COUNCIL OF CALIFORNIA PAC |
$25,000.00 |
8/29/2012 |
How did the party spend all of its money? Here’s a visualization of every penny of party expenses, including rent, postage and cell phone services. The information that stands out: $225,000 transferred to two targeted state Senate candidates, Richard Roth and Cathleen Galgiani.
2012 Outgoing Contributions:
| DATE | PAYEE | CONTEST | AMOUNT |
| 10/8/2012 | CATHLEEN, GALGIANI | STATE SENATOR 8 |
$165,000.00 |
| 10/10/2012 | ROTH, RICHARD | STATE SENATOR 31 |
$60,000.00 |
The seven special interest contributions totaled $207,000, just a few dollars shy of the total transferred to the state Senate targets. It’s also worth noting that neither state Senate district included Humboldt County. If a multi-national corporation used this money laundering scheme to avoid taxes, Democrats would be outraged.
The GOP should rethink its campaign approach. California’s demographics are changing. But, the biggest contributing factor to the Democrats’ dominance was money.
(Note: These graphics were created with Wordle.net. This article with graphics may be republished with attribution to the author, John Hrabe, and a link to its original url.)
Crossposted on FlashReport

