California’s political class, led by Governor Brown, has been patting itself on the back for solving California’s problems. This celebration is ludicrous. What they’ve done amounts to a mere slowing down in a long-term political, fiscal, and demographic decline.
Demographic trends themselves are creating a crisis brought about by a population that is simultaneously losing its children and getting older, and to a frightening extent poorer. From 2000 to 2010, the percentage of Los Angeles’ population under 15 years old fell by 15.6 percent. This was the greatest decline of any U.S. major metropolitan area, and about double the U.S. average of 7.4 percent.
California’s poverty statistics are just as depressing. The state now is home to one-third of all US welfare recipients. According to a Census Bureau report, The Research SUPPLEMENTAL POVERTY REPORT: 2011 California has the nation’s highest poverty rate of any state. By its Supplemental Poverty Measure, 23.5 percent of California’s population is poor, while only 15.8 percent of the nation’s population is poor. No other state is above 20 percent.
Because of its aging and increasingly poor population, its dearth of young people and migratory trends, demand for government services in California will be increasing as the number of people available to pay for those services will be decreasing. Financing concurrent expenses will be hard enough. Paying for today’s excesses may prove impossible.
Let’s go through the evidence:
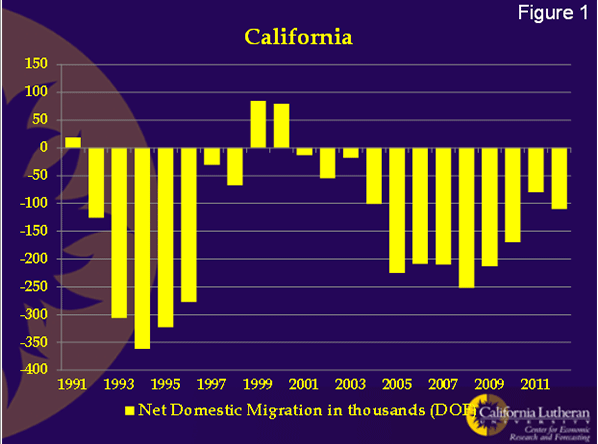
Figure 1 shows California’s Department of Finance’s (DOF) estimate of domestic migration, migration between California and other states. According to the DOF, California’s domestic migration has been negative in 18 of the past 20 years. This is less dismal than the U.S. Census’ estimate that California’s domestic migration has been negative for 20 consecutive years. This is the longest sustained period of negative domestic migration in California’s history. We’ve seen this before, in the rust belt. It leads to decay, poverty, increased crime, and unlivable cities.
Domestic migration is important because it should be seen as an early warning signal of eventual decline. Migrants are the proverbial “canaries in the coal mine”. When domestic migration is negative, people are voting with their feet. They are saying that California doesn’t provide enough opportunity to stay, particularly given its high cost of living. Given how comfortable it is to live in California, I think they make that decision reluctantly.
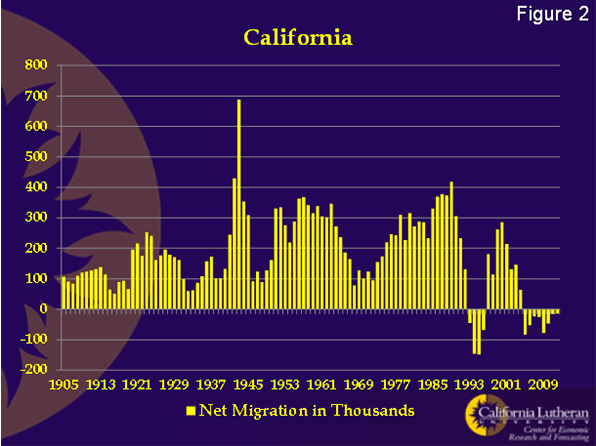
Over most of California’s recent history, international migration has been strong enough that total migration remained positive. That’s no longer true.
Figure 2 shows California’s total net migration for the past 107 years. Prior to 1993, California had never seen a year where total migration was negative. Now, we’ve have negative migration for eight consecutive years.
More critically, the rate of foreign migration in the state’s cities is falling behind many competitor cities. For example, over the last decade, New York had almost six times the increase in foreign born than Los Angeles. Houston, which has barely one third the population of LA-Orange County, increased its foreign born nearly four times as fast. Overall, LA-Orange had the lowest percentage increase of any major US metro. Given that the Southland has been the state’s immigration magnet for a generation, this is not good news.
Weak, negative migration is likely to continue. We used to characterize domestic migration as pull migration; rapidly growing economies attract migrants looking for opportunity. International migration, especially from other countries in this hemisphere, was thought to be push migration; conditions were so bad in the country of origin that migrants would come to California even in a recession.
Apparently, that’s no longer true. Mexico, for example, has an unemployment rate of about half of California’s today. When you add the increased cost imposed by coyotes on illegal immigrants (a price increase from about $3,000 a few years ago to about $6,000 today plus the requirement to carry drugs), it’s no mystery why California’s growers are having a hard time finding an adequate workforce.
Negative migration is important because migrants have been a critical part of California’s growth and creativity. Not only is California losing the services of the migrants who choose, say, Texas instead of California, California is suffering a drain of some of its talent pool, particularly among those about to have children.
For a long time, many people thought that California’s Hispanic population would cause its population growth rate to increase. That turns out to not be true.
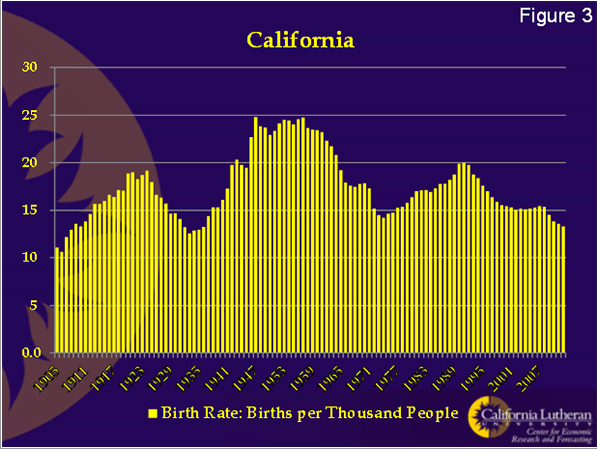
Figure 3 shows California’s birthrate. Our births per thousand population is the lowest it’s been since the worst part of the depression. What’s scary though, is the rate of decline. Births have fallen below 15 per thousand and seem destined to hit 10 per thousand. This is a national trend and a key reason to create national policies that encourage increased international immigration.
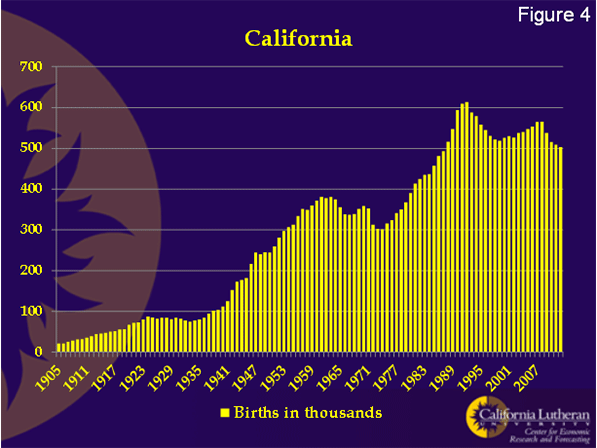
If a population is growing, it’s possible to have increasing births (new people) even when the birth rate is declining. Unfortunately, California isn’t there.
Figure 4 shows the total number of births in California. It’s fallen to 500,000 per year from 600,000 per year about 20 years ago. If California’s birth rate falls to 10 percent, we can expect the number of births to decline to about 350,000. At that point, the math starts to get to be a problem. Is a decline to 10 per thousand possible? You bet.
According to the CIA, as of 2012, 29 out of 221 countries (13 percent) had birth rates below 10 per thousand. Those 29 countries included Japan, Germany, Switzerland, South Korea, and Singapore.
Unfortunately, California — as opposed to states such as Texas — could reach a 10 per thousand birth rate within 10 years if existing birth rate trends continue. Even more disturbing, there is no reason to believe that 10 per thousand is a lower bound. Germany, for example, has a birth rate of 8.33, while Hong Kong and Singapore have rates of only 7.54 and 7.72 respectively.
For California’s population to continue to grow, births have to outnumber the losses to migration and deaths. We’ve already discussed migration. What about deaths?
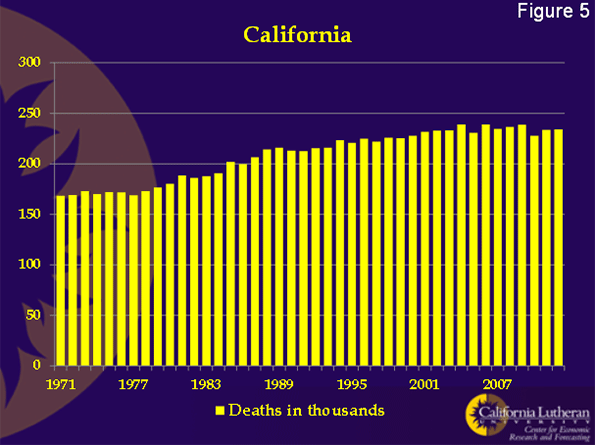
Figure 5 shows annual California deaths from 1971 through 2012. While recently flat, the trend is up, and an aging population implies more increases. For our calculations, we’ll assume California deaths at 250,000 per year. This is a conservative assumption. As the Baby Boomers age, California deaths will increase.
When California’s birth rate falls to 10 per thousand, we can expect 350,000 births. Deaths will be about 250,000. Apparently, as long as outmigration doesn’t exceed 100,000 California’s population won’t decline overall.
The good news is that outmigration in excess of 100,000 has only happened once. California’s net outmigration exceeded 100,000 for two consecutive years in the 1990s, when California was undergoing a dramatic economic realignment brought about by the end of the Cold War.
The bad news is that we’ve come very close to losing 100,000 twice in the past eight years, particularly during the housing boom. Many people believe that low home prices are restraining domestic outmigration, because people are waiting for equity to return before making the move. Higher home prices and increased tax rates could drive big increases in the numbers of people leaving California.
Unless there is some dramatic change, it is almost inevitable that California will suffer a declining population within a generation. The way to avoid this calamity is create an economic environment that encourages job growth and economic activity.
At the same time, it appears prudent to begin planning now for an aging and possibly smaller population. Increased government revenues through more robust and varied economic activity would help here, but more probably needs to be done. California needs to reform its business climate, reduce its debt and unfunded liabilities, and do so quickly.
Crossposted on newgeography


