“Once people get the facts, they do not support slashing people’s pensions.” – Dave Low, chairman, Californians for Retirement Security (Washington Post, February 25, 2014)
Really?
Making sure “people get the facts” is difficult when most “facts” the public sees are promulgated to the media by pension fund PR departments eager to preserve the torrent of taxpayers money flowing into their favored investment firms, along with PR firms representing taxpayer-funded public sector unions whose primary reason to exist is to increase the wages and benefits of their members.
According to the most recent data available from the California State Controller – over $600 billion of taxpayer’s money is privately invested by public employee pension funds (Public Retirement Systems Annual Report, FYE 6-30-2011, released 5-22-2013, page xv, Figure 2), and every year, taxpayers pour another (woefully inadequate) $27 billion into these financially troubled funds (same report, page xxii, Figure 12).
As for the California’s public sector unions? It’s hard to get facts on these massive institutions whose operations – despite being 100% funded by taxpayers – are largely defined by their opacity. But just in California, their collective revenues per year from dues and agency fees can be reliably estimated at over $1.0 billion per year.
Those are two pretty big elephants in this room we call California, Mr. Low.
Chairman Low’s comment was quoted in an article entitled “In San Jose, generous pensions for city workers come at expense of nearly all else.” The focus of the article was the exodus of public safety personnel from San Jose, since their pensions have been “slashed” as the result of a reform initiative passed by nearly 70% of voters.
So what are the facts about public safety pensions in San Jose?
Getting these facts are also difficult, but earlier this week, the California Public Policy Center released a study entitled “Evaluating Public Safety Pensions in California,” with San Jose’s independent pension system one of those selected for analysis. The other two were the independent pension system serving public safety retirees from Los Angeles, and public safety retirees who participate in CalPERS.
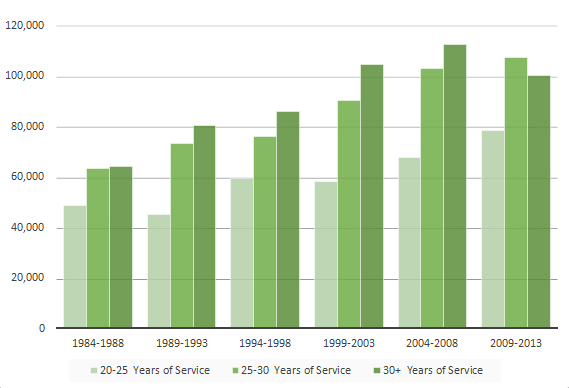
As documented in this study, the average retired public safety employee in San Jose collects a pension considerably better than the average public safety retiree from Los Angeles, or the average public safety retiree who is part of the massive CalPERS system. Factoring in the length of service, and the year of retirement, take a look at these pensions:
City of San Jose Public Safety Retirees
Average Base Pension by Years of Service and Year of Retirement
 It is very important to note that these averages are just for “base pension.” In general, based on the data received from other pension systems who supplied the additional data, public safety retirees collect at least $10,000 per year in health benefits that are not considered part of their base pension, and San Jose is no exception (ref. SJ safety retiree health benefits). This means the average public safety retiree in San Jose, if they retired in the last ten years and worked 25 years or more, collects a pension and benefit package that averages over $110,000 per year.
These are the “facts,” Mr. Low. This is what voters decided to “slash,” although if you read Measure B, “slash” is not exactly the first thing that comes to mind. “Sanity” may be more appropriate.
The reader looking for additional “facts” may wish to click on this link, which points directly at individual pension amounts for the most recent fiscal year for which data is available: “San Jose Police and Fire Retirement Plan (2012).” For that matter, perhaps the factually minded reader may wish to click on this link, which points to how much individual public servants currently working for the City of San Jose’s made according to the most recent data: “All salaries for San Jose (2012).”
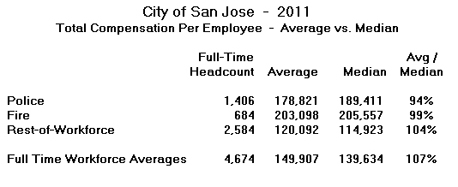
The observant viewer of these links to San Jose’s city employee pay and pension data will note, factually, that the vast majority of highly compensated individuals work in public safety. But what about the averages? What is the average total pay and employer-paid benefits for San Jose’s public servants? For that, refer to the next chart, taken from another California Policy Center study entitled “San Jose, California – City Employee Total Compensation Analysis,” using 2011 payroll data provided by the city itself:
 Lest anyone suspect that “averages” for pay – and the pensions whose value is calculated based on final rates of pay – are misleading because of a handful of overpaid executives, please note that median pay for San Jose’s public safety employees exceeds their average pay.
No reasonable person questions the need to pay public safety personnel a premium for the work they do. But to preserve defined benefits, not to mention the financial survival of our cities and counties, we must make tough decisions now, to avoid having to “slash” later.
Ed Ring is the executive director of the California Policy Center

