
(Editor’s Note: With an eye on the upcoming election, the Public Policy Institute of California takes a detailed look at the California voters — their demographic characteristics, party affiliations, political ideologies, and views on key issues. Over the next four days Fox and Hounds Daily will publish this breakdown of the California voters starting with today’s entry, California Voter and Party Profiles.)
Voter registration is up since the last gubernatorial primary; major party registration is down.
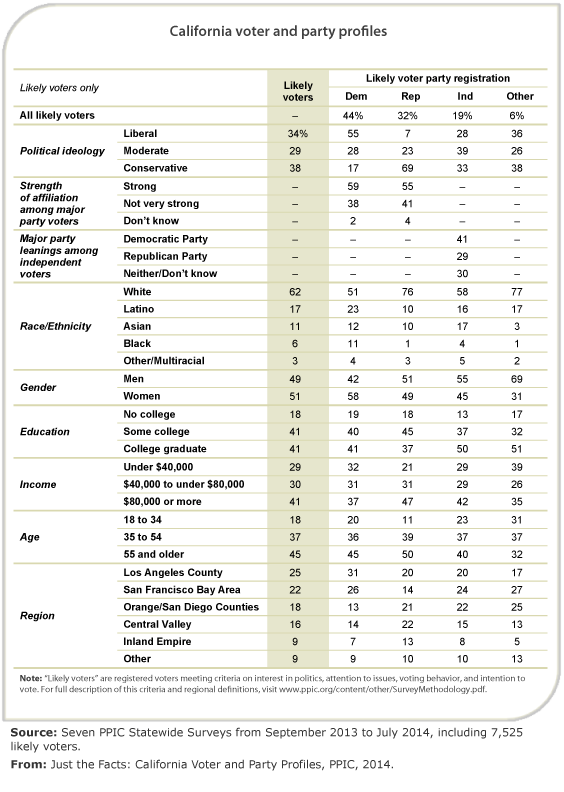
California’s 17.7 million voters constitute 73.3% of eligible adults, up slightly from 72.4% in 2010, the last gubernatorial primary year. The share of Democrats is 43.4%, down from 44.5% in 2010. The share of Republicans has also declined from 30.8% in 2010 to 28.4% in 2014. The share of voters who say they are independent (also known as “decline to state” or “no party preference”) is 21.2%, up from 20.2% in 2010. Our surveys indicate that among those we consider most likely to vote, 44% are Democrats, 32% are Republicans, and 19% are independents.
 Independent likely voters continue to lean Democratic; partisans are ideologically divided.
More independent likely voters continue to say they lean more toward the Democratic Party (38% in 2010, 41% today) than toward the Republican Party (30% in 2010, 29% today); 30% do not lean toward either major party (32% in 2010). Ideologically, Republicans are more cohesive than Democrats: slightly more than half (55%) of Democratic likely voters describe themselves as liberal, while 69% of Republican likely voters say they are conservative. Independent likely voters are more likely to be middle-of-the-road (39%) than conservative (33%) or liberal (28%). Among independents who lean toward neither major party, 15% are liberal, 53% are moderate, and 32% are conservative. Among those who lean Democratic, 54% are liberal; most who lean toward the Republican Party are conservative (64%). One of areas in which ideological divisions are most evident is taxation and spending: 63% of Democrats would prefer to pay higher taxes and have a state government that provides more services, while 79% of Republicans prefer lower taxes and fewer services; independents have a slight preference for lower taxes and fewer services (51% to 44%).
Party affiliation of likely voters varies across major racial and ethnic groups.
Although 44% of the state’s adult population is non-Hispanic white and 34% is Latino, according to our surveys, 62% of those most likely to vote are white and only 17% are Latino. The shares of Asian (11%) and black (6%) likely voters are similar to their shares of the state’s adult population (14% Asian, 6% black). About half (51%) of Democratic likely voters are white; 23% are Latino, 12% are Asian, and 11% are black. An overwhelming majority (76%) of Republican likely voters are white; relatively few are Latino (10%), Asian (10%), or black (1%). Among independents, 58% are white, 17% are Asian, 16% are Latino, and 4% are black.
Other demographic characteristics of likely voters also vary across parties.
Democratic likely voters are more likely to be women (58%) than men (42%), while independents are more likely to be men (55%) than women (45%). Republicans are closely divided (51% men, 49% women). Half of independents (50%) are college graduates, compared to fewer Republicans (37%) and Democrats (41%). About three in 10 Democrats (32%) and independents (29%) have household incomes under $40,000, compared to two in 10 Republicans (21%). Young adults (18 to 34) make up similar shares of Democrats and independents (20% Democrats, 23% independents), as do adults age 55 and older (45% Democrats, 40% independents). By contrast, Republicans are less likely to be young adults (11%) and more likely to be 55 years or older (50%).
Democrats and Republicans tend to live in different parts of the state.
The regional distribution of likely voters mirrors that of the state’s overall adult population. Most Democrats live in Los Angeles County (31%) or the San Francisco Bay Area (26%), while most Republicans live in the Central Valley (22%), Orange and San Diego Counties (21%), or Los Angeles County (20%). Independents are most likely to live in the San Francisco Bay Area (24%), Los Angeles County (20%), or Orange and San Diego Counties (22%).