
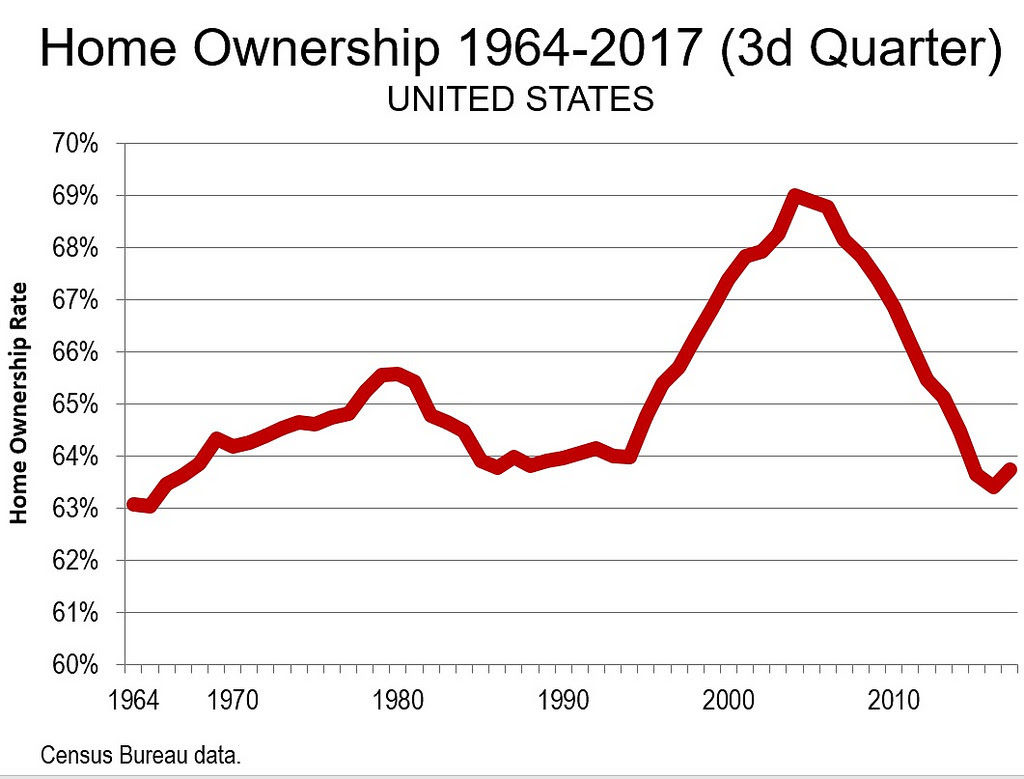
 The Census Bureau reports that home ownership in the United States rose to 63.9 percent in the third quarter of 2017. This continues a rising trend since the second quarter of 2016, when home ownership had dropped to 62.9. This equaled the previous low of 51 years before (1965), just a year after annual data reporting began. Home ownership peaked at 69.2 percent during the housing bubble and had been generally declining since late 2006 (Figure).
Home Ownership and the Housing Bubble
Overall the drop in home ownership from 69.2 percent to the modestly recovering 63.9 percent is substantial. However, the last two decades have been unrepresentative of US home ownership. Any comparison of the declining recent rates must be considered in light of the Great Financial Crisis. The authors of a Federal Reserve Bank of San Francisco working paper (Paolo Gelain of the European Central Bank and Norges Bank, Kevin J. Lansing of the Federal Reserve Bank of San Francisco and Gisle J. Natvik of the BI Norwegian Business School) expressed the view that the “U.S. housing boom was a classic speculative bubble involving naive projections about future asset values, imprudent lending against risky collateral, and ineffective regulatory oversight.”
There was plenty of blame to go around. Regulators at the very top failed to recognize the seriousness of the problem. Mortgage lenders so weakened lending standards that qualifying households insufficient financial means were soon to default. Then there was “securitization,” which researchers have associated with higher default rates (Benjamin J. Keys of the University of Michigan, Tanmoy Mukherjee of Sorin Capital Management. Amit Seru of the University of Chicago and Vikrant Vig of the London Business School).
With their focus on national level data, another government failure was missed by economists, geographic differences between the worst housing cost escalation and losses to the metropolitan areas with more stringent land use regulation. Indeed, if the more stringently regulated metropolitan areas had replicated the price trends of the traditionally regulated markets, the financial losses nationwide might have been 75 percent less. The result would certainly have been a less severe economic decline, or the Great Financial Crisis might have been avoided altogether.
The losses were substantial. In the less than two years between April of 2007 and January of 2009, household wealth dropped $13 trillion. This was a loss nearly as great as the gross domestic product at the time ($14.5 trillion), and was equal to $125,000 per household. True enough, this loss was recovered by the end of 2012. But, as happens in any recovery, the losers do not necessarily recover their losses.
At the same time, there is increasing concern about rising inequality, especially after publication of Thomas Piketty’s Capital in the 21st Century. Matthew Rognlie, now of Northwestern University, found that virtually all of the increased wealth inequality has been in housing equity. More recently, Gianni La Cava of the Bank for International Settlements (the “central bank of central banks”) concluded that the rising income equality in the United States is “concentrated in states that are constrained in terms of new housing supply.”
Comparing to Relevant History
Thus, the appropriate comparison for today’s home ownership rate is not the debacle of last two decades. It is rather the success of the decades before, which saw a nearly 50 percent increase relative to pre-World War II home ownership rates from 44 percent in 1940 to 64 percent in 1970. The current 63.9 percent home ownership rate is nearly as high as the average annual rate of 64.3 percent from 1964 to 1994. The maximum home ownership rate during those three decades of apparently successful regulation and competent mortgage industry management was only 1.7 percentage point higher than today (65.6 in 1980). Indicating the far greater market volatility of the past two decades, with the bubble, bust and regulatory overreach, the 2007 peak was more than three times higher than in 2017 (5.3 percentage points). Today’s home ownership rate is in the historic “ballpark.”
The Future?
The important question is where does home ownership go from here. There is no question that the recent increase is an improvement. Another 15 months as successful as the last 15 would raise the rate to a level exceeded only five times between 1964 and 1995. And, there still remains a clear preference for home ownership.
There are, however, serious potential headwinds. Younger households are saddled with unprecedented levels of student debt. Household income growth has been muted, to say the least. Perhaps the most pessimistic scenario has been presented (among other more optimistic scenarios) by Arthur Acolin (University of Southern California), Laurie S. Goodman (Urban Institute) and Susan M. Wachter (University of Pennsylvania), who suggested that if the rest of the nation followed California’s experience, the national home ownership rate could drop to 50 percent by 2050.
House prices in California have escalated in an unprecedented manner, in large measure due to land use regulations making it largely impossible to deliver new housing for the “minimum profitable production costs,” as shown by economists Edward Glaeser of Harvard and Joseph Gyouko of the University of Pennsylvania). Substantial urban fringe land use restrictions make construction of tract housing at historical housing affordability ratios virtually impossible.
Avoiding California, etc.
With its far stronger land use regulation, implemented in recent decades, California’s house prices relative to incomes (“median multiple”) have skyrocketed to 135 percent above those in markets where there is more liberal, traditional land use regulation. Each of California’s major metropolitan areas are now rated as severely unaffordable (the worst category of affordability) in the 13th Annual Demographia Housing Affordability Survey. Before California abandoned traditional regulation, its income adjusted house prices were only 30 percent higher than in the traditionally regulated markets.
The problem goes beyond home ownership. California has the highest gap between the costs of renting and buying in California than elsewhere in the nation (the price-to-rent ratio). Among the 53 major metropolitan areas, San Francisco, San Jose, Los Angeles, San Diego and Sacramento show the largest affordability gap between renting and buying. That makes home ownership doubly challenging for would-be first time buyers.
A future in which only 50 percent of households could afford houses would mean considerably less affluent middle-income households and higher poverty rates. It would stunt economic growth, because both the many more renters and buyers paying more would have less discretionary income to buy other goods and services. This could retard economic growth, as Chang-Tai Hseih and Enrico Moretti have already found to have happened, even with stringent regulation that has been somewhat limited geographically (beyond California to markets most notably like Portland, Seattle, Denver, and Miami).
Of course, maintaining the normal home ownership rates of the last past half-century will require strong economic growth, and the return of three percent growth over the past two quarters is a good start in the right direction. But there is much more to the equation that national economic policy.
States, localities and metropolitan areas have an important role to play. It will be important for governments in traditionally regulated metropolitan areas to avoid the policies of California and the other stringently regulated markets. This could also be challenging, because of the strong proclivity of urban planners to impose the stringent urban containment policies that have been associated with destroyed housing affordability from Sydney to Hong Kong, Toronto, London and Auckland. Should they fail, the most pessimistic predictions might come true. This would be as unavoidable and unnecessary as the Great Financial Crisis. And the human costs would be considerable.