
Last Wednesday brought the latest jobs numbers for California, through January of this year. We are now in the 94th month of employment expansion. This is the second longest employment expansion in California since World War II, behind only the 113 month expansion of the later 1960s.
What do the latest numbers mean? Is the employment picture really as good as it seems? What about part time jobs, persistent long term unemployment, or low labor force participation? And when will this employment expansion end?
For these questions and others regarding jobs, we turn to the Labor Market Information Division of the California Employment Development Department, especially its monthly Labor Market Review.
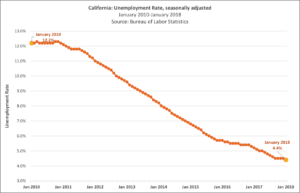
Let’s start with the graphs below on the two indicators most widely cited: the state’s unemployment rate and job growth. As you can see, it wasn’t too long ago (2010) that our state unemployment rate remained for months over 12%, and there was concern that it would never go down. Instead, the rate has gone down fairly steadily to 4.4% in January 2018—the lowest since the new methodology was introduced in 1976.
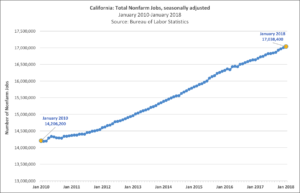
At the same time, monthly job growth has been steady, with the total of 2,851,000 jobs added since February 2010. We have grown to over 17 million payroll jobs by January of this year.
I have written several times over the past decade on Fox & Hounds about the limitations of both of these two main indicators, the unemployment rate and payroll numbers. Nonetheless, they are good starting points, especially the payroll numbers.
The other three indicators we will want to look at are part-time employment (especially involuntary part time employment), duration of unemployment, and labor force participation rate. The first two of these indicators continue to move in positive directions, while the third is a little more uncertain.
LMID publishes monthly data on part-time employment—defined as working less than 35 hours a week. 18.4% of the California labor force was working part time in December 2017, down from 19.3% in December 2016. Perhaps more importantly, both of these percentages are down significantly from the numbers a few years back. Part-time employment rose to over 21% of the California workforce in December 2011 during the Great Recession, before going down steadily in the past six years.
Among part-time workers, the sub-group that California policy makers are most concerned with are those working part-time “for economic reasons”: workers who are working part-time but say that they seek full-time work. The number of these workers reached a high of 1,528,000 during the Great Recession and as late as December 2015 stood at 1,022,000. Today that number is down to 782,000 Californians—though even this number is above pre-Great Recession levels.
The indicator that has dropped most dramatically in recent years has been the number and percentage of the “long term unemployed”, those Californians unemployed 27 weeks or more. That number stood at 843,000 in March 2010, when the employment recovery was just starting. It was as high as 643,700 as late as May 2014. Today the number of long term unemployed Californians is down to 229,000.
The labor force participation rate is the indicator of greater uncertainty. California’s labor force participation rate in recent years has been generally below 62.5%, and has reached some of its lowest levels since the late 1970s. The most recent rate for January was 62.1%, below the national rate of 62.7% and not significantly increased in the past few years. It remains well below the pre-Great Recession rates of 66% in 2007 and 2008. This depressed labor force participation is being driven by workers of all ages, not just the Baby Boomer retirements.
One employment question that has arisen in the past few years has focused on how many of the new jobs are low wage jobs. EDD does not track on a monthly basis the wages of new jobs being added. But thoughtful recent reporting on wage increases in California (and nationwide) can be found here and here.
Finally, where are we heading in 2018? As noted in the first paragraph, we are in the longest employment expansion in 40 years, but one that is still short of the expansion we experienced in California in the 1960s. The UCLA Anderson School estimates state job growth to be 1.9% in 2018, which would add roughly another 320,000 payroll jobs. This seems generous, though the nationwide job growth announced a few days ago for March showed job gains outpacing expectations. Our next job report will be on March 23.