
America’s elite central business districts have symbolized the ascendency of big cities, epitomized by soaring office towers. But today, due the COVID-19 pandemic, so much office work performed in these CBDs can be done remotely, that their future seems far less towering than in the past. In contrast, less dense areas, notably exurbs, appear to have suffered less loss in their employment patterns.
This is not because these functions are unnecessary, but they do not need nearly the office space once imagined. much of their economic activity has continued outside the office. A Stanford University survey indicates that 42 percent of the workforce is working remotely — about 8 times the normal rate reported by the American Community Survey for 2018.
This article describes the reduction in work visits, by counties within the six combined statistical areas (CSAs) that have the nation’s six “transit legacy cities” (the municipalities of New York, Chicago, Philadelphia, San Francisco, Boston and Washington) at their cores. These cities (which are to be contrasted with metropolitan areas) accounted for 58% of transit commuting destinations in 2018 and have the six largest downtowns (central business districts or CBDs) in the United States. These dense developments function as the urban cores of the larger labor market CSA definition by the Office of Management and Budget. Each of these CSAs well served by lengthy commuter rail systems, as well as radial express freeways.
The Google Mobility Reports
The data is from the “Google COVID-19 Community Mobility Reports,” which estimate trips by people compared to a base of for various activities, including trips to the workplace. According to Google:
The reports use aggregated, anonymized data to chart movement trends over time by geography, across different high-level categories of places such as retail and recreation, groceries and pharmacies, parks, transit stations, workplaces, and residential. We’ll show trends over several weeks, with the most recent information representing 48-to-72 hours prior. While we display a percentage point increase or decrease in visits, we do not share the absolute number of visits. To protect people’s privacy, no personally identifiable information, like an individual’s location, contacts or movement, is made available at any point.
Trip rates are compared to a baseline of January 3 to February 6, 2020. The period covered is the month of June, when many parts of the nation were “locked down.” We have used the Google daily data, developing daily averages compared to the baseline period of January 3 to February 6, 2020.
These data reflect the economic disruption that COVID-19 has unleashed upon not only the CSAs, but their suburban and exurban ring components. They capture a measure of the decline in trips to work by people now working from home and by people who have lost their jobs, either permanently or temporarily. Both of these factors have created economic disruption. The first, working at home, has severely impacted businesses, for example downtown restaurants, bars and hotels that rely on work location driven commerce. Many are now deserted, and, like empty offices, could impact commercial real estate in the longer term, depending on how permanent is the current increase in remote working. The more challenging economic prospects of those who have been laid off is perhaps the most important disruption.
The discussion below describes the classification into CSA sectors (generally core, suburban and outside the principal metropolitan area), weighting the Google work visit figures by the workplace employment in each county (using ACS 2014-2018 work place data). These data are provided as very general estimates.
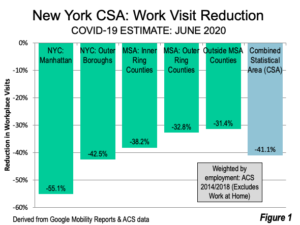
New York CSA: The 41 county New York CSA (12,400 square miles, 33,100 square kilometers) extends beyond the metropolitan area to include counties such as Fairfield (Bridgeport-Stamford) and New Haven in Connecticut, Mercer (Trenton) in New Jersey, Dutchess and Orange in New York and Monroe in Pennsylvania. New York is the largest CSA and has a sufficient number of counties to produce a more fine-grained analysis. Further, the New York CSA has the most diverse in urban form in the nation, with by far the nation’s densest central business district and the highest density neighborhoods as well as overall suburban densities in the New York barely one half that of Los Angeles suburbs, and smaller urban area densities that are one-third to one-fifth that of Los Angeles suburbs (New Haven and Poughkeepsie).
The largest percentage loss in workplace visits was (Brooklyn Queens and Hudson [Jersey City]). New York City’s four outer boroughs experienced a loss of 42.5% workplace visits. The inner suburban counties, all of which are adjacent to the city of New York, had an average loss of 38.2%. The outer suburban counties, which include all other counties in the metropolitan area, lost a considerably lower drop of 32.8%. The counties in the adjacent metropolitan area (in the CSA, but not in the MSA) lost 31.4%. Overall, workplace visits were down 41.1% in the New York CSA (Figure 1).
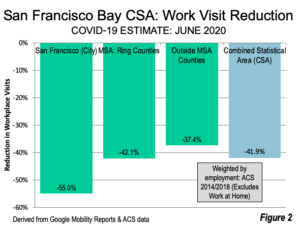
San Francisco Bay CSA: The 14 county San Francisco Bay CSA (10,600 square miles, 27,500 square kilometers) extends beyond the 5-county MSA to include counties such as Santa Clara, Sonoma, Solano and three in the San Joaquin Valley (San Joaquin, Stanislaus and Merced).
The city of San Francisco equaled Manhattan in its drop in workplace visitations, at 55.0%. Santa Clara County (San Jose), the center of Silicon Valley, but outside the San Francisco metropolitan area, suffered a drop of 48%, while suburban San Mateo County lost 46%. Overall, the employment weighted loss in the suburban counties of the MSA was 42.1%, while the loss in the CSA counties outside the MSA such as San Joaquin and Merced was 37.4%. The overall CSA loss was 41.9% (Figure 2).
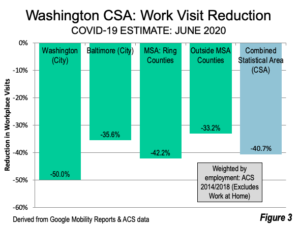
Washington CSA: The 41-county Washington-Baltimore CSA (13,600 square miles, 35,100 square kilometers) was created by the merger of two of the nation’s largest metropolitan area. It extends to counties in Pennsylvania and West Virginia. This analysis separates the city of Baltimore, rather than considering it a suburb of Washington.
The city of Washington experienced the third worst workplace visitation loss among the six CSAs, at 50%. The largest loss in the CSA was in Arlington County, VA, adjacent to the District of Columbia, at 51.0%. The city of Baltimore, which is not a transit legacy city, has a smaller downtown and less reliance on transit had a loss of 35.6%. The other counties of the MSA lost 42.2%. The counties outside the MSA lost 33.2%. The overall CSA loss was 40.7% (Figure 3).
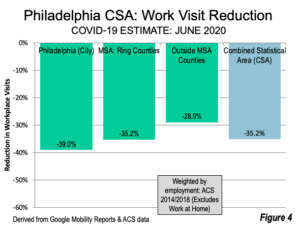
Philadelphia CSA: The 16-county Philadelphia CSA (7,300 square miles, 19,000 square kilometers) includes additional counties in Pennsylvania, such as Atlantic (Atlantic City) and Berks (Reading). The city of Philadelphia lost 39.0% of its workplace visits. The suburban counties declined 35.2%, while the counties outside the MSA lost 28.9%. The overall CSA loss was 35.2% (Figure 4).
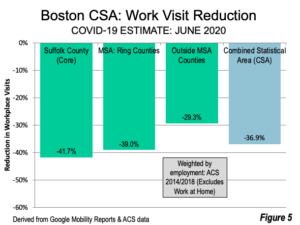
Boston CSA: Unlike the CSA’s above, the 19-county Boston CSA (9,700 square miles, 25,100 square kilometers) does not have a separate county equivalent jurisdiction for its core city (Boston). The core Suffolk County is largely dominated by Boston, and which experienced a workplace visit loss of 41.7%.Suburban MSA counties lost 39.0%, while counties outside the CSA lost 29.3%. Overall, the Boston CSA loss was 36.9% (Figure 5).
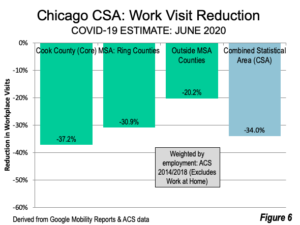
Chicago CSA: The 19-county Chicago CSA ((8,900 square miles, 23.000 square kilometers) core county is Cook, includes the city of Chicago and a large suburban population. Cook County’s workplace visits were down 37.2%. It is likely that the city of Chicago’s workplace visits were down more, because it represents a smaller percentage of the central county than in the other five CSAs. The suburban counties had a loss of 30.9%, while the counties outside the MSA lost 20.2%. The overall loss was 33.9% (Figure 6).
Denser Areas Subject to Greater Economic Disruption
Just as denser areas of urbanization have borne the brunt of Covid-19 fatalities, they have also absorbed a disproportionate share of lost economic activity. Overall the workplace visit loss in counties with transit legacy cities reaches 46.7 percent while those outside, with their lower urban densities and greater dispersion of jobs fell by 32.9percent. All economies have proven vulnerable to the pandemic, but certain areas, particularly those with the transit legacy cities, with the largest CBDs and most transit dependency, have suffered markedly worse.
Cross-posted at New Geography