(Editor’s Note: With an eye on the upcoming election, the Public Policy Institute of California takes a detailed look at the California voters — their demographic characteristics, party affiliations, political ideologies, and views on key issues. Tuesday we published California Voter and Party Profiles. Yesterday, PPIC’s authors covered California’s Likely Voters. Today, PPIC looks at California’s Independent Voters.)
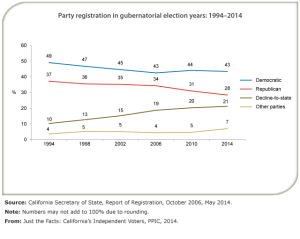
The share of independent voters continues to increase.
The percentage of California voters registered as independent or decline-to-state voters as of the June 2014 primary was 21.2% —it has more than doubled since the November 1994 gubernatorial election (10.3%). Over the same period, the percentage of voters affiliated with each of the major parties has fallen: Republicans from 37.2% to 28.4%, Democrats from 49% to 43.4%. The share of independents is slightly higher today than in May 2010 (20.2%), as is the number of independent voters (3.75 million today, 3.42 million in May 2010). The number of registered voters has also increased slightly, from 17 million in May 2010 to 17.72 million in May 2014. Since the most recent gubernatorial election in 2010, Democratic registration is down 1 percentage point and Republican registration is down 3 points.
A plurality of independents lean toward the Democratic Party.
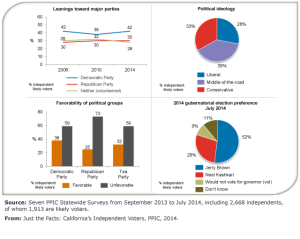
Our surveys over the past year indicate that more independents who are likely to vote lean toward the Democratic than toward the Republican Party (42% to 30%), while 28% lean toward neither party. Democratic leanings among independents were similar in 2006 (42%) and 2010 (38%), as were their Republican leanings (28% in 2006, 30% in 2010) and the share leaning toward neither major party (30% in 2006, 32% in 2010). Four in 10 independent likely voters view themselves as ideologically middle-of-the-road (39%), while three in 10 self-identify as liberal (28%) and one in three say they are conservative (33%). Among independents who lean toward the Republican Party, a majority self-identify as conservative (64%), while just over half of Democratic Party leaners self-identify as liberal (54%).
 Most independents say a third party is needed.
When asked if the Republican and Democratic Parties do an adequate job representing the American people, or if they do such a poor job that a third major party is needed, independent likely voters (72%) are much more likely than partisans (55% Republicans, 49% Democrats) to say a third party is needed.
Independents align with Democrats on some issues …
On issues that divide voters along party lines, independent likely voters often agree with Democrats. For example, on same-sex marriage, 77% of Democrats and 63% of independents are in favor, while a majority of Republicans are opposed (55% oppose, 41% favor). On taxing the wealthy, 81% of Democrats and 57% of independents are in favor, while 68% of Republicans are opposed.
… but they are an ideologically divided group.
On many issues that divide partisans, independents are themselves divided. When asked for opinions of the 2010 health reform law, for example, strong majorities of partisans fall on their party’s side of the debate, while independent likely voters are divided (45% favorable, 50% unfavorable). A similar pattern holds regarding the basic question of the size of government (Democrats: 63% higher taxes and more services; Republicans: 79% lower taxes and fewer services; independents: 51% lower taxes and fewer services, 44% higher taxes and more services). It’s important to note that there are differences among independent voters: those who lean toward the Democratic Party hold different views than those who lean Republican.
Independents hold unfavorable opinions of major parties but support Democrats in elections.
Most independent likely voters have unfavorable views of the Democratic Party (59%), the Republican Party (73%), and the Tea Party movement (59%). Leading up to the 2014 gubernatorial election, independents prefer Jerry Brown, the Democrat, to Neel Kashkari, the Republican (52% to 28%).

