
Orange County has evolved from a Republican stronghold to a credible target of opportunity for the Democrats seeking to take control of the U.S. House of Representatives in the November election.
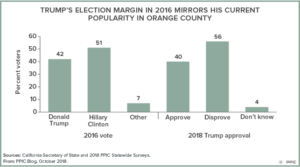
Until the most recent presidential election, Republican candidates had won in every top-of-the-ticket statewide race in Orange County for 20 years. In fact, the last time that a Democratic presidential candidate carried Orange County was in 1936. But in 2016, Democrat Hillary Clinton defeated Republican Donald Trump by 51 to 42 percent, a margin of 102,813 votes. Moreover, Clinton received more votes than Trump in each of the four Orange County House seats now held by Republicans.
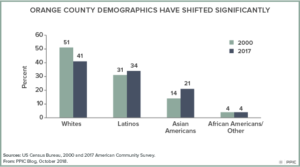
Tectonic shifts in Orange County’s demographics and voter registration set the stage for the surprising 2016 presidential outcome and the competitive 2018 House races. First, Orange County’s population is transitioning. Since 2000, the proportion of whites has declined from 51 percent to 41 percent of the population. Latinos now make up to 34 percent and Asian Americans make up 21 percent of the population. Most Latino and Asian American likely voters are registered Democrats today.
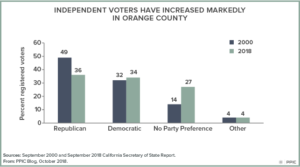
Second, Orange County’s political stripes have changed from red to purple. Since 2000, the proportion of registered Republican voters has declined from 49 percent to 36 percent. Registered Democrats have increased to 34 percent and independents have increased to 27 percent. Today, most independent likely voters lean toward the Democratic Party. In sum, Republicans’ electoral clout is diminishing in Orange County.
Since this midterm election is a referendum on the president, how is Donald Trump viewed by Orange County voters? The Public Policy Institute of California’s Statewide Survey has been tracking President Trump’s popularity by asking the following question, “Overall, do you approve or disapprove of the way that Donald Trump is handling his job as president of the United States?” In five 2018 PPIC surveys, 40 percent approve and 56 percent disapprove of President Trump when combining the results for registered voters in Orange County.
Approval of Trump’s presidency in Orange County varies widely by party: 79 percent of Republicans, 30 percent of independents, and 13 percent of Democrats. Half of whites approve of his performance, while 28 percent of nonwhites approve. Overall, Trump’s approval rating in Orange County of 40 percent in 2018 closely mirrors his 2016 vote total, which was 42 percent. This indicates his political base in Orange County has not grown during his time in office.
Voter turnout will be the political wildcard in Orange County. Since 2000, Orange County’s voter turnout in midterms has been on average 21 points lower than in presidential elections. Low turnout this year would be a throwback to the “old” Orange County electorate—more Republicans and whites. A high turnout would reflect the “new” Orange County—more Democrats, independents, and nonwhites.
We’ll know in a month whether the new or old Orange County will prevail in 2018. But given the demographic and registration trends, the Orange County of the future will be very different from the one that consistently voted for Republicans.